
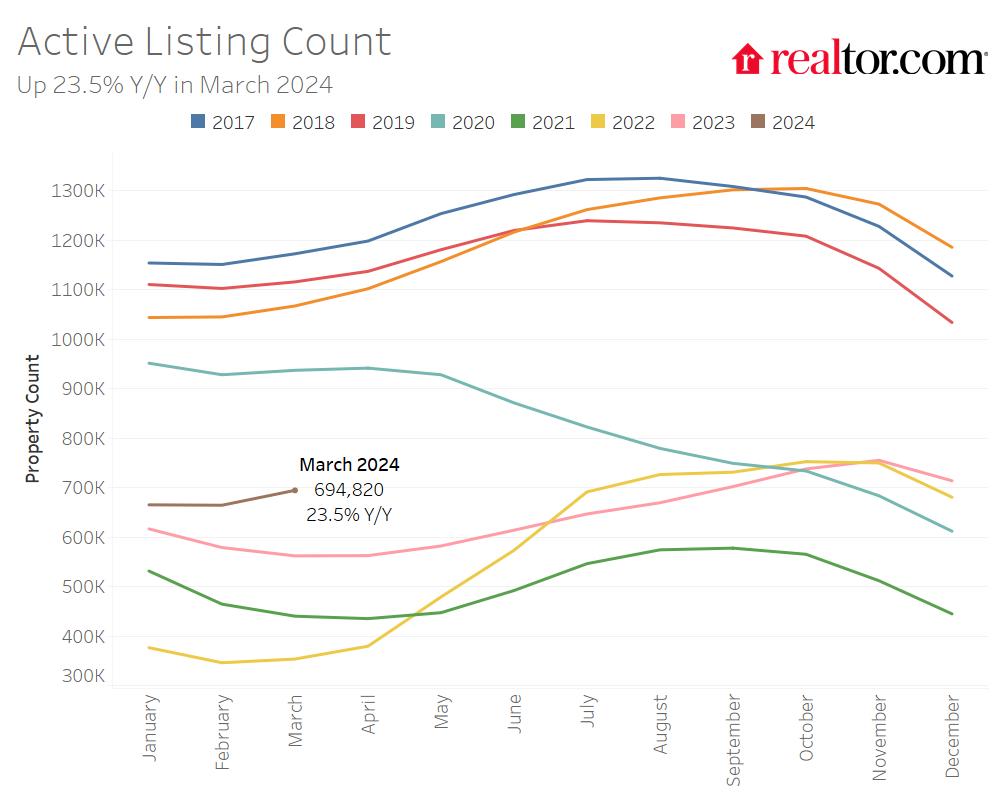
- The number of homes actively for sale was notably higher compared with last year, growing by 23.5%, a fifth straight month of growth.
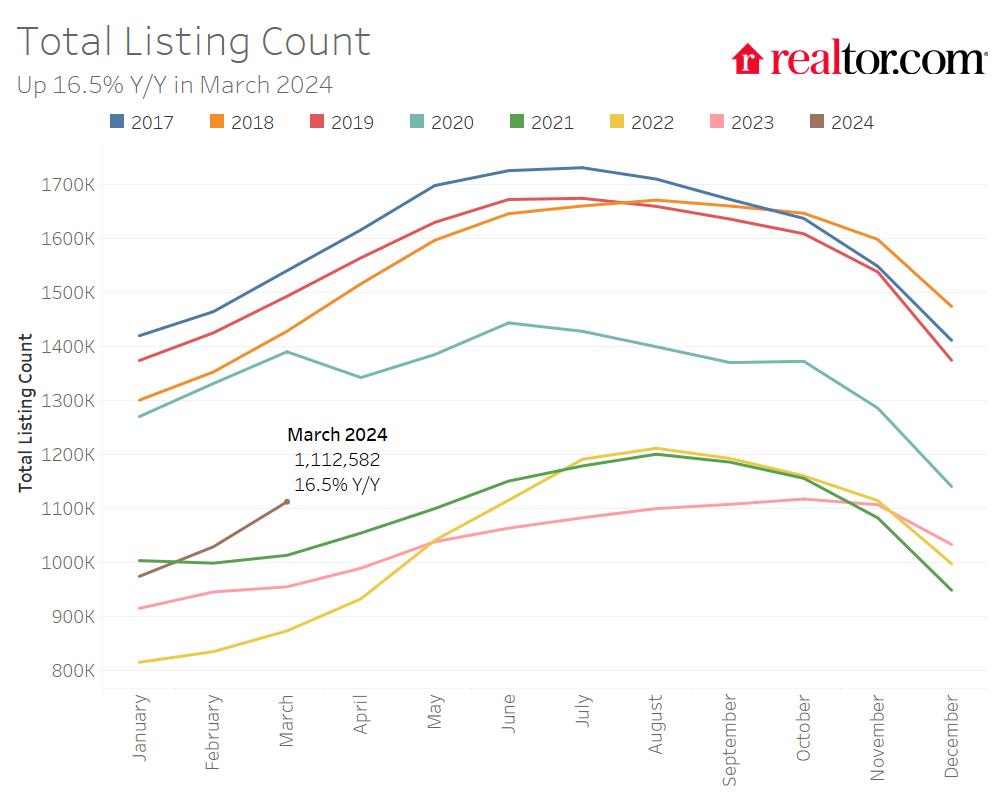
- The total number of unsold homes, including homes that are under contract, increased by 16.5% compared with last year.
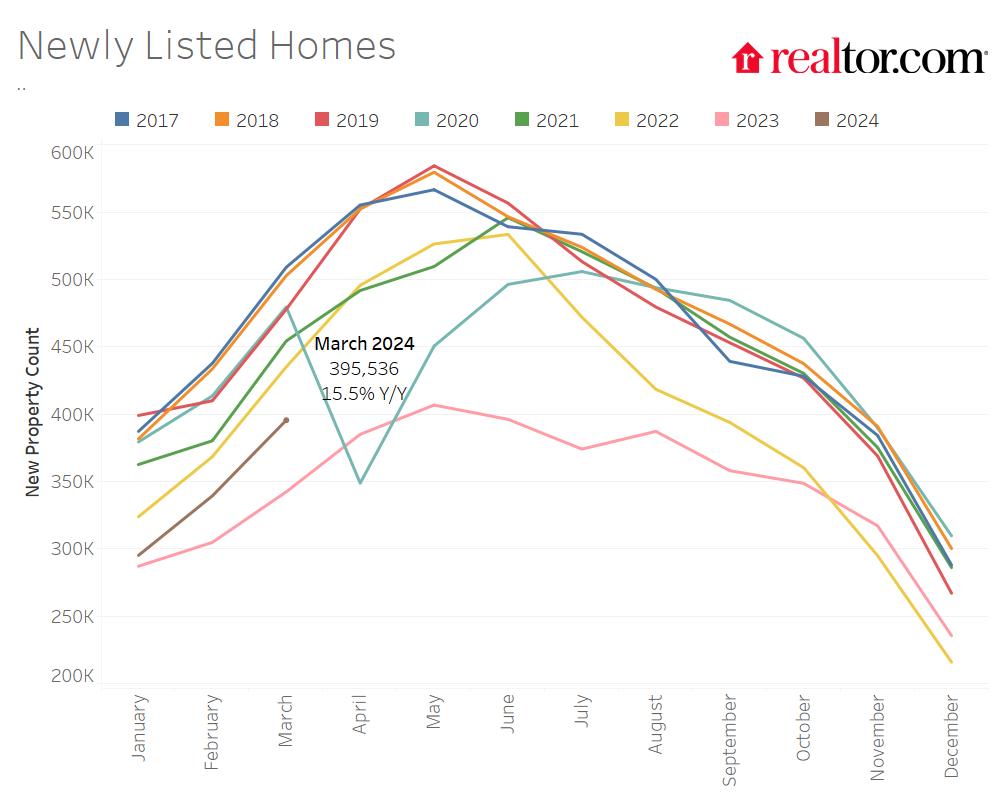
- Home sellers were more active this March, with 15.5% more homes newly listed on the market compared with last year.
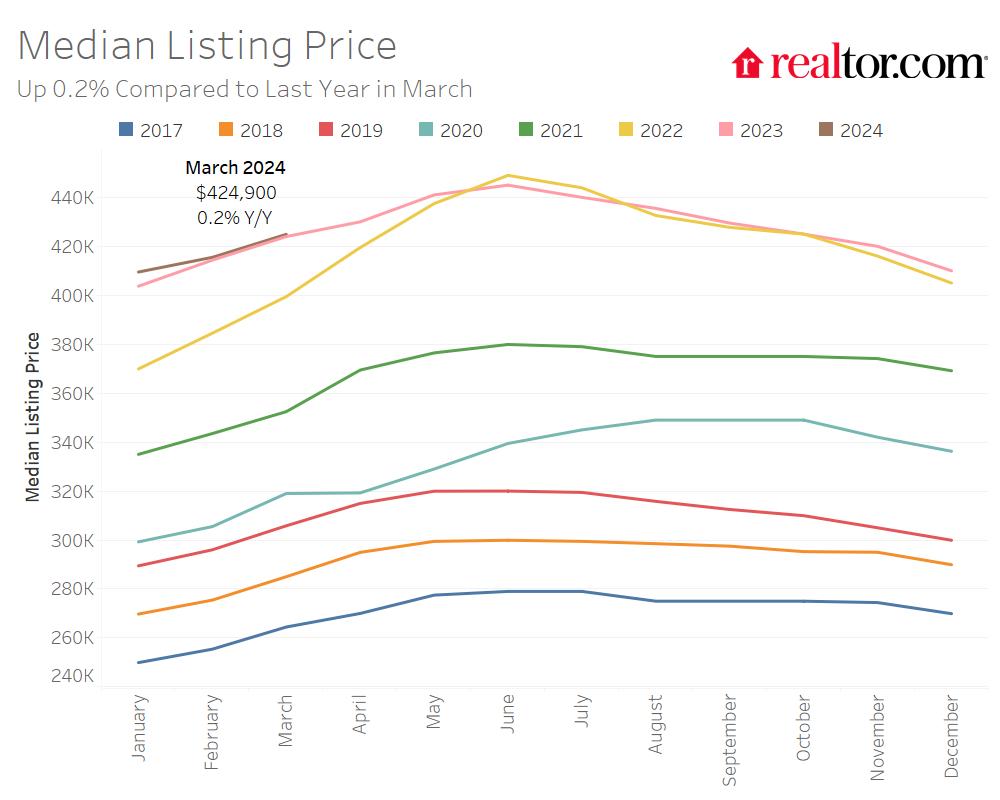
- The median price of homes for sale this March remained relatively stable compared with the same time last year, increasing by only 0.2%.
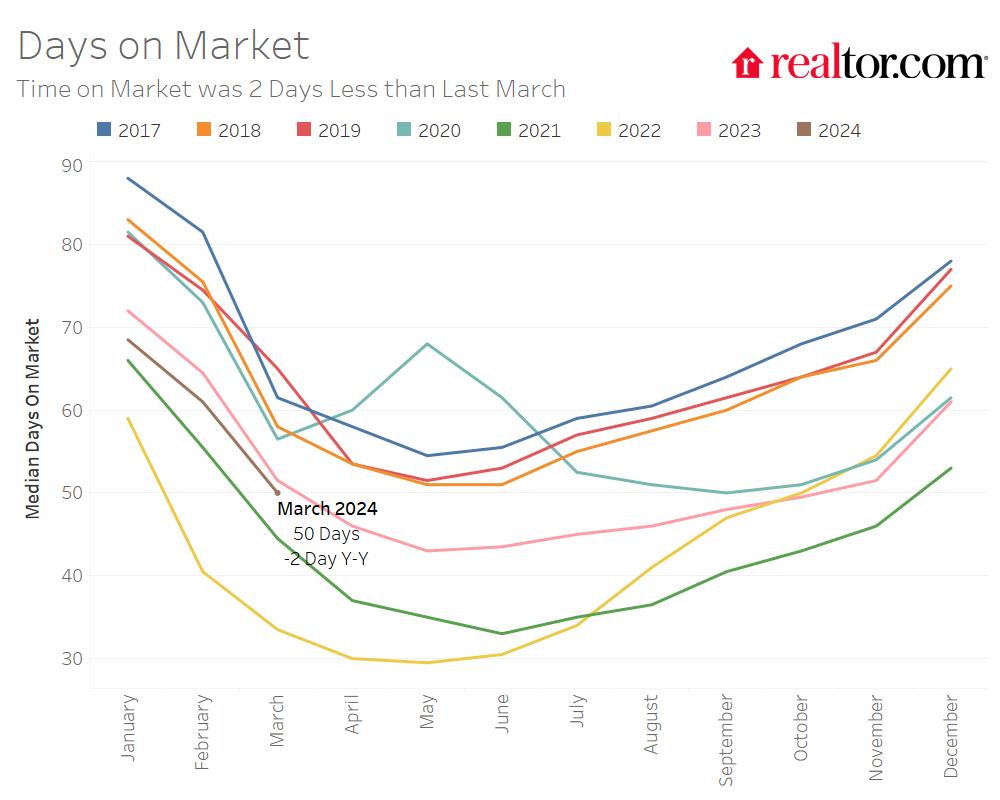
- Homes spent 50 days on the market, which is two days shorter than last year and 12 days shorter than before the COVID-19 pandemic.
Based on the March housing data from Realtor.com®, the inventory of homes for sale nationwide continued to increase. This rise in inventory was fueled by a positive sentiment among home sellers, leading to more affordable newly listed homes entering the market. Consequently, the nation saw a modest growth rate in median home listing prices, partly due to the highest level of price reductions observed since our records began in 2017, tying with March 2019.
As we enter the spring homebuying season, prospective buyers can expect to find a slightly larger selection of affordable homes, particularly in the Southern region. However, despite this improvement in affordability, homes remain scarcer and prices higher relative to incomes compared to previous years.
While there has been an uptick in listing activity, the decision of the Federal Reserve’s Open Market Committee in March to maintain the policy interest rate and the expectation of sustained higher rates could result in a gradual recovery of the housing market throughout the year.
Nevertheless, although many sellers are still affected by high mortgage rates, there is evidence of increased selling interest compared to last year. For sellers looking to sell their homes in 2024, our Best Time To Sell Report recommends the week of April 14–20 as offering the most favorable housing market conditions for sellers.
Home listing activity continued to increase in March
There were 23.5% more homes actively for sale on a typical day in March compared with the same time in 2023, marking the fifth consecutive month of annual inventory growth.
For the first three months of this year, the inventory of homes actively for sale was at its highest level since 2020. However, while inventory this March is much improved compared with the previous three years, it is still down 37.9% compared with typical 2017 to 2019 levels.
In March, as in the previous month, the growth in homes particularly priced in the $200,000 to $350,000 range outpaced all other price categories, as home inventory in this range grew by 30.5% compared with last year.
Continuing into the spring homebuying season, prospective homebuyers will find more options compared with previous years, particularly for more affordably priced homes. However, the inventory of homes for sale overall remains less abundant than in pre-pandemic years.
The number of homes for sale in the 50 largest metro areas in the U.S. increased by 16.5%. However, inventory in this group of metro areas as a whole is still 34.3% below pre-pandemic levels. The rise in active listings was primarily driven by the South, which saw active home listings grow by 35.8% compared with last year. In March, all four regions saw active inventory grow over the previous year. The Midwest saw listings grow by 13.9%, while inventory grew by 12.4% in the West and only 0.3% in the Northeast.
Similarly to last month, the South as a whole has also been largely driving the increase in availability of homes priced between $200,000 and $350,000, a price category that saw the most year-over-year growth nationally. Home listings located in the South made up more than half (57.4%) of available inventory in March 2024, up from 43.3% in March 2019.
The inventory of homes actively for sale increased in 45 out of 50 of the largest metros compared with last year, and in four large metros, inventory was above pre-pandemic levels. Metros that saw the most inventory growth included Tampa (+58.3%), Orlando (53.3%), and Miami (48.2%). In large Florida metros, the growth in inventory was primarily driven by an increase in the availability of attached homes (condos, townhomes, or row homes).
Despite higher inventory growth compared with last year, most metros still had a lower level of inventory when compared with pre-pandemic years. Among the 50 largest metro areas, only four metros saw higher levels of inventory in March compared with typical 2017 to 2019 levels. These four metros were San Antonio (+27.1%), Austin (+18.1%), and Dallas, Denver (+4.6%, respectively).
The total number of homes for sale, including homes that were under contract but not yet sold, increased by 16.5% compared with last year, growing on an annual basis for the fourth month in a row after ending a seven-month streak of annual total listing declines.
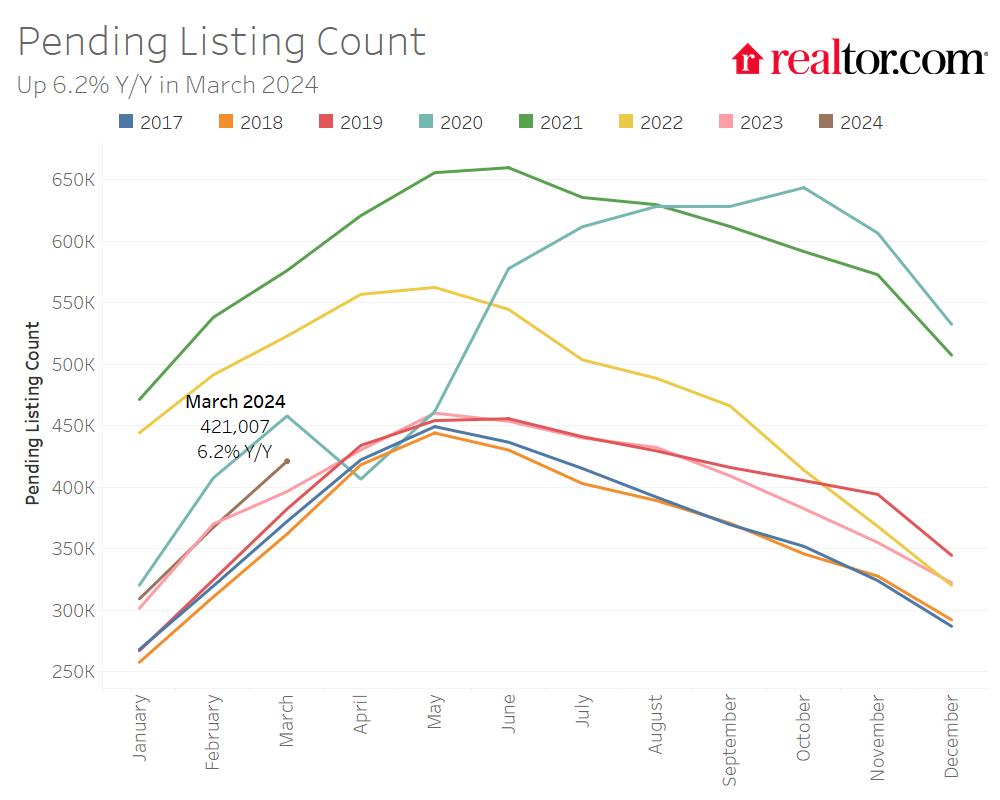
The number of homes under contract but not yet sold (pending listings) increased by 6.2% compared with last year, resuming positive growth after the previous month’s decline.
Pending homes are an early indicator of the direction of existing home sales, which did tick up 9.4% in February, to an annualized pace of 4.38 million. However, the Federal Reserve’s Open Market Committee opted to keep its policy rate stable in March, and its revised expectations included a slightly higher for longer interest rate environment. This likely means that mortgage rates will continue to remain higher for longer, prolonging the time to recovery for home sales.
However, providing a boost to overall inventory, sellers turned out in higher numbers this March as newly listed homes were 15.5% above last year’s levels. This marked the fifth month of increasing listing activity after a 17-month streak of decline.
Fannie Mae’s Home Purchase Sentiment Index, which also measures buying and selling sentiment, continued to show an improvement in home selling sentiment. The net share of respondents who said that now is a good time to sell increased by 11 percentage points in February over the previous month and 20 percentage points over the same month last year.
Newly listed homes in the 50 largest metro areas increased by 11.6% compared with the previous year in March, on average. Newly listed home inventory increased the most in the West, by 21.3%, whereas new inventory grew by 15.6% in the South, 14.1% in the Midwest, and 7.9% in the Northeast.
In March, 48 of the 50 largest metros on our list saw new listings increase over the previous year. The metros that saw the largest growth in newly listed homes included Sacramento (+32.5%), Tampa (+29.3%), and San Diego (+25.9%). The two that had yet to catch up were Richmond (-9.4%) and New Orleans (-4.8%).
Homes are still spending less time on the market than last year, but the gap is shrinking
The typical home spent 50 days on the market this March, which is two days shorter than the same time last year and around two weeks (12 days) less than the average March from 2017 to 2019. However, the gap between last year and this year is shrinking as inventory grows.
In the 50 largest metropolitan areas, the typical home spent 40 days on the market, on average, which is four days less than last March. This month, not all regions saw the inventory of homes for sale spend less time on the market than last year.
In the South, where the growth in home inventory has been the largest, the typical home spent the same amount of time on the market in March as last year. However, in the Midwest (-6 days), Northeast (-6 days), and West (-5 days), homes are still spending less time on the market than last March.
Time on the market decreased compared with last year in 41 of the 50 largest metro areas this March. It decreased the most in Kansas City (-20 days), Las Vegas (-15 days), and Austin (-11 days). Time on the market only increased compared with last year in eight of the 50 largest metros, including New Orleans (+9 days), Hartford (+8 days), and Louisville (+4 days). However, nine markets saw homes spend more time on the market than typical 2017 to 2019 pre-pandemic timing, including Portland (+9 days) and Los Angeles (+6 days).
The median listing price remained stable compared to last March as price reductions increased
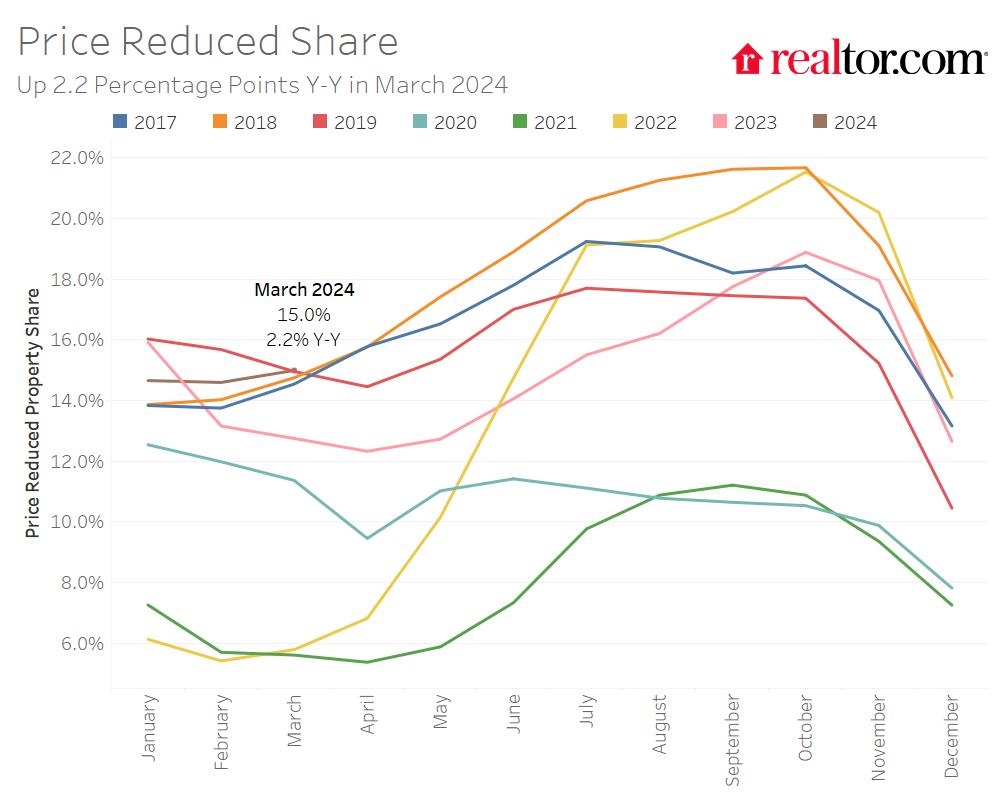
The national median list price continued to increase seasonally, to $424,900 in March compared with $415,500 in February, and the median list price remained relatively stable compared with the same time last year increasing by only 0.2%. Yet the share of listings that had their price reduced also increased in March, by 2.2 percentage points compared with the previous year.
While the median listing price has remained relatively stable versus to last year, higher mortgage rates compared with last March still increased the monthly cost of financing 80% of the typical home by roughly $63 (2.9%) compared with a year ago. This increased the required household income to purchase the median-priced home by $2,500 to $88,600, before accounting for the cost of tax and insurance. However, as growth in the median list price has declined and mortgage rate growth has slowed, the increase in the monthly cost to purchase a home has also declined. While the cost to purchase a home is still growing, at least the rate of growth has slowed, giving consumers a chance to catch up.
In February, average hourly earnings grew by 4.3% annually, finally outpacing the growth in the cost to purchase the median-priced home, 9 months after wages first outpaced overall inflation (May 2023).
As mentioned previously, the percentage of homes with price reductions increased from 12.7% in March of last year to 15% this year. The share of price reductions is currently tied with 2019 for the highest March level since our records began in 2017, as sellers adjust to more competitive home listings and hampered buyer demand from years of declining affordability relative to incomes.
In the largest metropolitan areas, the combined annual median list price growth rate for active listings was 2.0%, outpacing the national rate. In March, listing prices remained stable on a year-over-year basis in the South (-0.1%), where competitive home inventory has grown the most, but prices continued to increase in the Northeast (+5.1%), Midwest (4.1%), and West (+0.5%) compared with the same time last year. On an adjusted per-square-foot basis, prices in all regions grew similarly, by 4.5% to 4.9%, as soft median list price growth in the West and South was driven by a larger inventory of affordable, smaller homes available for sale.
Prices in Los Angeles (+15.1%), Richmond (+11.8%), and Pittsburgh (+11.6%) saw the biggest increases among large metros. Eighteen metros saw their median list price decline compared with last year, up from 11 last month. The metros included Miami (-8.4%), Oklahoma City (-8.3%), and San Francisco (-7.6%). However, on a price-per-square-foot basis, listing prices in Miami, Oklahoma City, and San Francisco declined only by 3.6%, 1.5%, and 1.2%, respectively, as the mix of listing inventory consisted of smaller homes relative to the previous year.
The share of price reductions was up compared with last year in the South (+3.5 percentage points), Midwest (+1.0 percentage points), Northeast (+0.5 percentage points), and West (+0.2 percentage points. More than half (34) of the 50 largest metros saw the share of price reductions increase compared with last March, up from 29 in February. Portland saw the greatest increase (+9.7 percentage points), followed by Tampa (+8.3 percentage points) and Orlando (+6.2 percentage points).
March 2024 Regional Statistics*
| Region | Active Listing Count YoY | New Listing Count YoY | Median Listing Price YoY | Median Listing Price Per SF YoY | Median Days on Market Y-Y (Days) | Price-Reduced Share Y-Y (Percentage Points) |
| Midwest | 13.9% | 14.1% | 4.1% | 4.5% | -6 | 1.0 pp |
| Northeast | 0.3% | 7.9% | 5.1% | 4.5% | -6 | 0.5 pp |
| South | 35.8% | 15.6% | -0.1% | 4.6% | 0 | 3.5 pp |
| West | 12.4% | 21.3% | 0.5% | 4.9% | -5 | 0.2 pp |
March 2024 Regional Statistics vs Pre-Pandemic 2017–19*
| Region | Active Listing Count vs Pre-Pandemic | New Listing Count vs Pre-Pandemic | Median Listing Price vs Pre-Pandemic | Median Listing Price Per SF vs Pre-Pandemic | Median Days on Market vs Pre-Pandemic (Days) | Price-Reduced Share vs Pre-Pandemic (Percentage Points) |
| Midwest | -53.7% | -27.0% | 53.9% | 59.9% | -18 | -2.8 pp |
| Northeast | -61.9% | -33.4% | 66.8% | 75.0% | -22 | -3.4 pp |
| South | -26.3% | -11.2% | 43.9% | 63.0% | -12 | +1.8 pp |
| West | -30.5% | -25.0% | 45.0% | 61.1% | -2 | -0.9 pp |
March 2024 Housing Overview by the 50 Largest Metros
| Metro Area | Median Listing Price | Median Listing Price YoY | Median Listing Price per Sq. Ft. YoY | Active Listing Count YoY | New Listing Count YoY | Median Days on Market | Median Days on Market Y-Y (Days) | Price– Reduced Share | Price-Reduced Share Y-Y (Percentage Points) |
| Atlanta-Sandy Springs-Alpharetta, Ga. | $410,000 | 0.0% | 4.0% | 22.1% | 11.9% | 41 | -5 | 15.7% | 2.6 pp |
| Austin-Round Rock-Georgetown, Texas | $550,000 | 0.0% | 2.0% | 15.8% | 19.0% | 40 | -11 | 22.3% | -4.5 pp |
| Baltimore-Columbia-Towson, Md. | $335,000 | -3.8% | 2.4% | 11.6% | 6.5% | 36 | -7 | 11.3% | 1.1 pp |
| Birmingham-Hoover, Ala. | $290,000 | 4.0% | 5.3% | 27.6% | 12.6% | 50 | -1 | 13.1% | -0.1 pp |
| Boston-Cambridge-Newton, Mass.-N.H. | $880,000 | 6.9% | 10.0% | 0.9% | 7.3% | 24 | -4 | 9.7% | 1.3 pp |
| Buffalo-Cheektowaga, N.Y. | $270,000 | 9.7% | 9.6% | 4.2% | 3.7% | 38 | -7 | 5.3% | -0.3 pp |
| Charlotte-Concord-Gastonia, N.C.-S.C. | $410,000 | 2.1% | 5.8% | 19.9% | 1.2% | 38 | -4 | 16.5% | 4.1 pp |
| Chicago-Naperville-Elgin, Ill.-Ind.-Wis. | $375,000 | 6.4% | 7.3% | -7.7% | 2.0% | 33 | -7 | 7.8% | -1.8 pp |
| Cincinnati, Ohio-Ky.-Ind. | $350,000 | -4.7% | 6.2% | 28.1% | 17.0% | 37 | -1 | 11.1% | 3 pp |
| Cleveland-Elyria, Ohio | $230,000 | 8.4% | 9.2% | 0.4% | 2.4% | 42 | -2 | 11.0% | 1.5 pp |
| Columbus, Ohio | $380,000 | 0.8% | 6.8% | 20.2% | 9.7% | 29 | -1 | 14.2% | 2 pp |
| Dallas-Fort Worth-Arlington, Texas | $440,000 | -0.5% | 1.4% | 38.0% | 16.7% | 40 | -6 | 19.5% | 3.5 pp |
| Denver-Aurora-Lakewood, Colo. | $620,000 | -5.4% | 2.6% | 48.1% | 19.4% | 30 | 3 | 17.2% | 4.1 pp |
| Detroit-Warren-Dearborn, Mich. | $240,000 | 1.2% | 1.7% | 3.6% | 4.1% | 42 | -4 | 9.8% | -2.3 pp |
| Hartford-East Hartford-Middletown, Conn. | $400,000 | -0.7% | 4.7% | 6.1% | 6.5% | 37 | 8 | 5.1% | 0.6 pp |
| Houston-The Woodlands-Sugar Land, Texas | $363,000 | 0.7% | 1.3% | 23.5% | 20.1% | 43 | -4 | 16.7% | 2.4 pp |
| Indianapolis-Carmel-Anderson, Ind. | $330,000 | 5.5% | 5.8% | 23.5% | 8.3% | 42 | -4 | 16.2% | 2.6 pp |
| Jacksonville, Fla. | $415,000 | 3.9% | 4.6% | 38.6% | 22.1% | 47 | -5 | 22.1% | 4.6 pp |
| Kansas City, Mo.-Kan. | $425,000 | -6.6% | -4.0% | 8.1% | 20.7% | 51 | -20 | 11.2% | 2.9 pp |
| Las Vegas-Henderson-Paradise, Nev. | $470,000 | 4.4% | 5.8% | -33.1% | 8.4% | 38 | -15 | 13.7% | -6.4 pp |
| Los Angeles-Long Beach-Anaheim, Calif. | $1,150,000 | 15.1% | 8.1% | 5.4% | 17.8% | 42 | -4 | 9.0% | -0.4 pp |
| Louisville/Jefferson County, Ky.-Ind. | $315,000 | 2.3% | 3.6% | 14.5% | 5.9% | 40 | 4 | 13.6% | 0.6 pp |
| Memphis, Tenn.-Miss.-Ark. | $327,000 | 2.5% | 2.3% | 38.2% | 16.1% | 51 | -2 | 19.3% | 4.8 pp |
| Miami-Fort Lauderdale-Pompano Beach, Fla. | $549,000 | -8.4% | -3.6% | 48.2% | 16.6% | 58 | -2 | 19.7% | 5.5 pp |
| Milwaukee-Waukesha, Wis. | $365,000 | -0.3% | 5.2% | 9.9% | 12.4% | 29 | -4 | 7.9% | 0.7 pp |
| Minneapolis-St. Paul-Bloomington, Minn.-Wis. | $445,000 | -1.4% | -0.2% | 24.3% | 16.8% | 34 | -4 | 9.5% | 2.3 pp |
| Nashville-Davidson-Murfreesboro-Franklin, Tenn. | $559,000 | 6.0% | 6.9% | 9.3% | 3.6% | 32 | -3 | 18.8% | 0.6 pp |
| New Orleans-Metairie, La. | $329,000 | -0.3% | -0.5% | 27.7% | -4.8% | 67 | 9 | 17.8% | -0.6 pp |
| New York-Newark-Jersey City, N.Y.-N.J.-Pa. | $760,000 | 8.8% | 15.2% | -4.3% | 2.6% | 50 | -5 | 6.8% | -0.4 pp |
| Oklahoma City, Okla. | $321,000 | -8.3% | -1.5% | 22.9% | 17.4% | 45 | -6 | 17.2% | 5.2 pp |
| Orlando-Kissimmee-Sanford, Fla. | $439,000 | -0.4% | 2.0% | 53.3% | 14.6% | 54 | 1 | 20.2% | 6.2 pp |
| Philadelphia-Camden-Wilmington, Pa.-N.J.-Del.-Md. | $350,000 | 6.6% | 7.2% | -1.3% | 1.6% | 43 | -7 | 11.0% | 0 pp |
| Phoenix-Mesa-Chandler, Ariz. | $535,000 | 7.1% | 4.1% | 16.9% | 9.7% | 49 | -1 | 23.0% | -2 pp |
| Pittsburgh, Pa. | $240,000 | 11.6% | 9.9% | 10.8% | 1.3% | 55 | -9 | 12.9% | 0.8 pp |
| Portland-Vancouver-Hillsboro, Ore.-Wash. | $605,000 | -1.6% | 2.2% | 26.7% | 7.7% | 45 | 2 | 20.1% | 9.7 pp |
| Providence-Warwick, R.I.-Mass. | $500,000 | -2.8% | -1.7% | 0.1% | 12.1% | 35.5 | -6 | 6.3% | 0.6 pp |
| Raleigh-Cary, N.C. | $450,000 | 0.0% | 5.9% | 6.1% | 18.1% | 42 | -10 | 11.2% | -1.5 pp |
| Richmond, Va. | $450,000 | 11.8% | 8.7% | 8.8% | -9.4% | 44 | 3 | 9.1% | 1.3 pp |
| Riverside-San Bernardino-Ontario, Calif. | $599,000 | 7.1% | 7.1% | 7.5% | 15.2% | 47 | -7 | 13.0% | 0.4 pp |
| Rochester, N.Y. | $280,000 | 8.7% | 7.1% | -4.0% | 9.0% | 22 | -2 | 4.3% | -2.5 pp |
| Sacramento-Roseville-Folsom, Calif. | $635,000 | 1.3% | 4.2% | 16.9% | 32.5% | 36 | -7 | 11.1% | 1 pp |
| San Antonio-New Braunfels, Texas | $340,000 | -1.9% | -1.4% | 36.8% | 16.9% | 57 | 3 | 21.8% | 3.1 pp |
| San Diego-Chula Vista-Carlsbad, Calif. | $998,000 | 5.1% | 11.1% | 26.3% | 25.9% | 32 | -5 | 10.9% | 1.2 pp |
| San Francisco-Oakland-Berkeley, Calif. | $999,000 | -7.6% | -1.2% | 13.4% | 21.7% | 27 | -7 | 8.6% | -0.3 pp |
| San Jose-Sunnyvale-Santa Clara, Calif. | $1,481,000 | -0.9% | 1.1% | 2.2% | 21.5% | 22 | -5 | 5.8% | -1.6 pp |
| Seattle-Tacoma-Bellevue, Wash. | $768,000 | -2.7% | 1.4% | 20.3% | 19.5% | 29 | -3 | 8.7% | -0.8 pp |
| St. Louis, Mo.-Ill. | $292,000 | 4.7% | 4.8% | 14.2% | 4.9% | 39 | -8 | 10.3% | 0.8 pp |
| Tampa-St. Petersburg-Clearwater, Fla. | $419,000 | 2.2% | 3.0% | 58.3% | 29.3% | 51 | 0 | 27.6% | 8.3 pp |
| Virginia Beach-Norfolk-Newport News, Va.-N.C. | $391,000 | 4.8% | 6.4% | 14.3% | 2.2% | 34 | -4 | 13.2% | 2.3 pp |
| Washington-Arlington-Alexandria, DC-Va.-Md.-W. Va. | $604,000 | 0.8% | 6.6% | 2.2% | 3.2% | 31 | -3 | 8.7% | 0.9 pp |
Methodology
Realtor.com housing data as of March 2024. Listings include the active inventory of existing single-family homes and condos/townhomes/row homes/co-ops for the given level of geography on Realtor.com; new construction is excluded unless listed via an MLS that provides listing data to Realtor.com. Realtor.com data history goes back to July 2016. 50 largest U.S. metropolitan areas as defined by the Office of Management and Budget (OMB-202003).
* Note: In March 2024, our regional reporting was updated to reflect all listings within a region, compared to an average of the 50 largest metropolitan areas as previously reported.
